Keir Starmer’s resignation has given UK investors another political shock to digest. Andy Burnham’s run for the Labour leadership, and therefore the premiership, means Britain could soon have yet another prime minister.
Keir Starmer resigns — what it means for gilt yields, the pound and your investments
For investors, the obvious question is: what does this mean for my portfolio?
It’s a fair question, as politics can move markets. Tax policy affects savings, regulation affects investor behaviour, and government borrowing affects government bond (gilt) yields. Economic credibility can influence sterling, mortgage rates and investor confidence.
The mini-Budget under Liz Truss was a reminder that markets don’t always wait politely for the next election before passing judgement.
But history also gives investors a useful warning: the relationship between prime ministers, political parties and stock market returns is much messier than the headlines suggest.
Does the government affect the stock market?
A long-run chart of the FTSE All Share total return index tells an interesting story.
Over the decades, UK stocks have compounded through Conservative governments, Labour governments, financial crises, recessions, inflation shocks, leadership contests, referendums, wars, pandemics and political scandals.
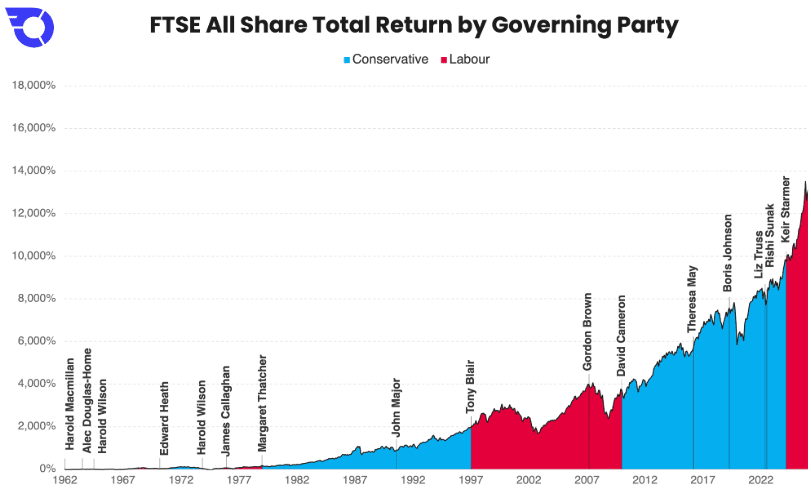
Past performance isn’t a guide to future returns. Source: Bloomberg. FTSE All Share Total Return Index, GBP.
The line hasn’t moved smoothly — far from it. But the broader direction has been up.
That’s an important point for long-term investors. The UK stock market hasn’t needed one particular party to be in power in order to generate returns. It has needed something more basic: profits, time, and reinvestment.
At first glance, however, the party comparison looks politically tempting. The average annualised return chart shows UK stocks performing better under Conservative governments than Labour ones, with an annualised return of 8.9% under Conservative administrations versus 6.4% under Labour.
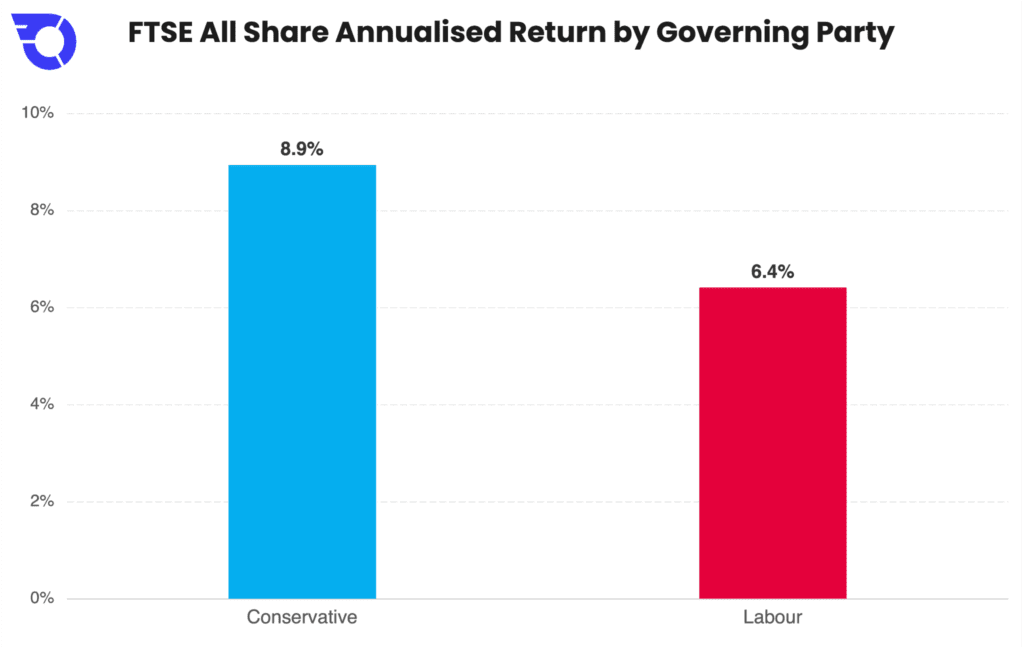
Past performance isn’t a guide to future returns.Source: Bloomberg. FTSE All Share Total Return Index, GBP. Returns are annualised over each party’s period in office.
That’s a useful statistic, but isn’t a complete explanation.
Investors should be careful not to mistake correlation for causation.
Governments inherit very different markets. Some arrive when shares are cheap, inflation is falling and interest rates are supportive. Others take office just before a global crisis. Some benefit from strong international growth. Others are punished by events mostly outside Westminster’s control.
The colour of the government matters, but so do starting valuations, inflation, interest rates, oil prices, sterling, global equity markets, wars, banking crises and the sector mix of the UK market.
That’s why the simple answer — “buy when one party wins, sell when the other does” — is too crude.
Which prime minister was best for the stock market?
If we rank the prime ministers covered by the FTSE All Share data, there’s one obvious outlier:
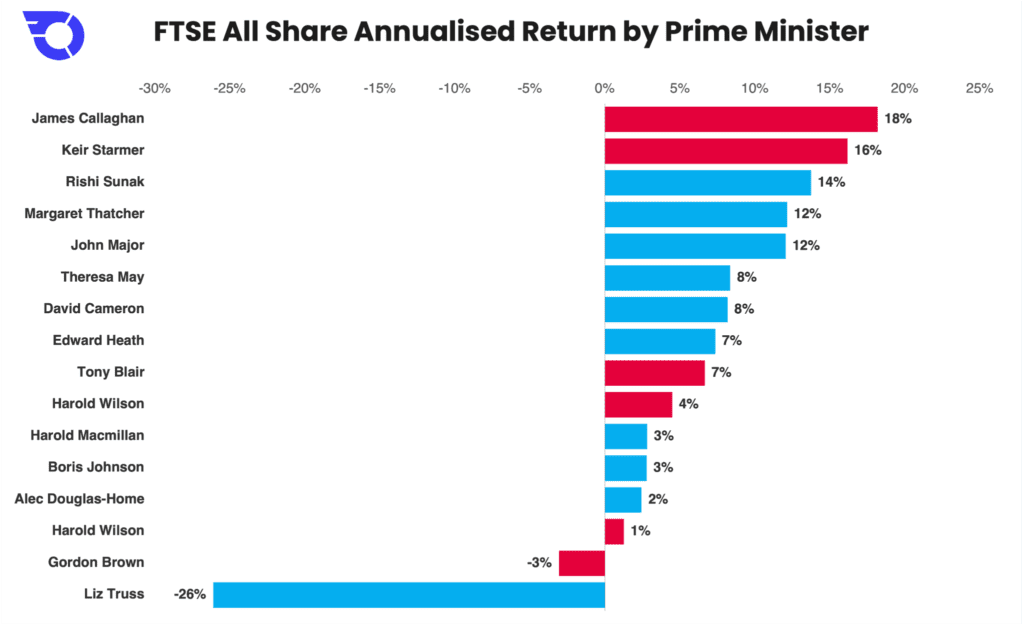
Past performance isn’t a guide to future returns. Source: Bloomberg. FTSE All Share Total Return Index, GBP. Returns are annualised over each prime minister’s period in office.
James Callaghan, Keir Starmer, Rishi Sunak, John Major and Margaret Thatcher appear near the top. But Liz Truss is at the bottom by a huge margin, with an annualised return of -26%.
This makes for a great chart, and an easy punchline — but it also shows why investors need context.
Short premierships can produce extreme results — a prime minister who happens to be in office during a short market rally can look like an investing genius. One who overlaps with a sell-off can look disastrous. The shorter the term, the less reliable the annualised figure becomes.
That doesn’t mean policy is irrelevant. Liz Truss is the obvious modern example of politics directly hitting markets.
The mini-Budget damaged confidence in the UK’s fiscal framework, sent gilt yields sharply higher and forced a rapid political reversal. Investors learned that the market may tolerate political change, but it will not ignore fiscal arithmetic.
But for most prime ministers, global forces did much of the heavy lifting.
Tony Blair’s time in office included the dot-com boom, the dot-com bust and a long expansion, ending just as the credit crunch was beginning to emerge.
Gordon Brown inherited the worst of that crisis.
David Cameron’s premiership included austerity, ultra-low interest rates, a post-crisis recovery and the Brexit referendum.
Boris Johnson’s included Brexit, Covid and an extraordinary burst of government spending and monetary support from the Bank of England (lower interest rates and lots of quantitative easing).
It’s hard to reduce any of that to one person.
Why markets aren’t controlled from Downing Street
The charts tell a useful story, but perhaps not the obvious one.
Yes, UK stocks have performed better on average under Conservative governments than Labour governments. Yes, some prime ministers have overlapped with much stronger annualised returns than others. Yes, political credibility can matter enormously, especially when government borrowing, tax and spending plans are in question.
But the bigger lesson is that markets are not controlled from Downing Street.
Prime ministers inherit economic cycles. They inherit valuations. They inherit inflation, interest rates and global shocks. They inherit investor sentiment. They inherit the consequences of decisions made years earlier.
That doesn’t let them off the hook entirely, though.
Good policy can help, and bad policy can hurt. Stable institutions, credible fiscal rules, sensible regulation and a serious growth plan all matter. But investors should avoid turning politics into a market-timing system.
For investors with long time horizons, the conclusion is to not build a portfolio around one politician.
What should investors do?
The temptation after a political shock is to do something. Sell UK shares. Buy UK shares. Rotate into gilts. Dump gilts. Move into cash. Long sterling. Short sterling.
But for most long-term investors, the better response is more boring.
Check how much you’re investing in different areas (your asset allocation). Make sure you’re not taking more UK political risk than you intended. Look at how much of your portfolio is in UK equities, global equities, bonds, cash and property. Think about whether your investments are diversified across regions, sectors and currencies.
That matters more than guessing the next prime ministerial market bounce.
UK investors often have a home bias, which is understandable: UK companies are familiar, UK funds are easy to buy, and UK dividends have historically been attractive.
However, the UK market isn’t the global market. It’s heavily weighted towards financials, energy, basic materials, consumer staples and healthcare. It has relatively little exposure to the large technology companies that have driven much of the US market’s performance.
So the question is not only “What does Burnham mean for the FTSE?” It is also “How much should the FTSE matter to my portfolio?”
For income investors, UK stocks may still have a role — the market offers dividend exposure and trades at lower valuations than the US. For global investors, however, the UK should be one part of a broader portfolio, not the whole strategy.
The market’s long-term return is usually shaped less by the name on the door of No 10 than the patience you can maintain. The next few months may tell us a lot about Burnham’s political instincts, but they will tell us rather less about the returns investors will earn over the next decade.
Hotter than the Nasdaq-100? 3 tech ETF themes to watch in 2026
Important information
Capital at risk. The value of your investments may go down as well as up, and you may get back less than you invest. Past performance is not indicative of future performance.
ETF costs apply. If in doubt, you may wish to consult a professional adviser for guidance.