Last year was another excellent year for markets. Investors will have been pleased with 2024’s returns, with equity investors enjoying positive returns across all major markets, driven by the continued dominance of a handful of mega-cap technology firms, which benefited from advancements in artificial intelligence. Bonds also saw positive returns, buoyed by high starting rates, despite the selloff over the final quarter as inflationary fears began to resurface.
As we step into 2025, investors face a landscape marked by heightened market concentration and persistent valuation concerns, particularly in the US stock market. The dominance of a few mega-cap stocks has intensified, raising questions about the implications for portfolio diversification and long-term returns. Investors must grapple with whether “this time is different”, or if historical patterns of mean reversion will prevail. Adding to the complexity are potential geopolitical and economic risks, including the evolving political landscape shaped by Donald Trump’s influence. In this market outlook for 2025, we will look at each of these points in turn, and consider how investors should be positioning themselves amidst this uncertainty.
Concentrated stock markets
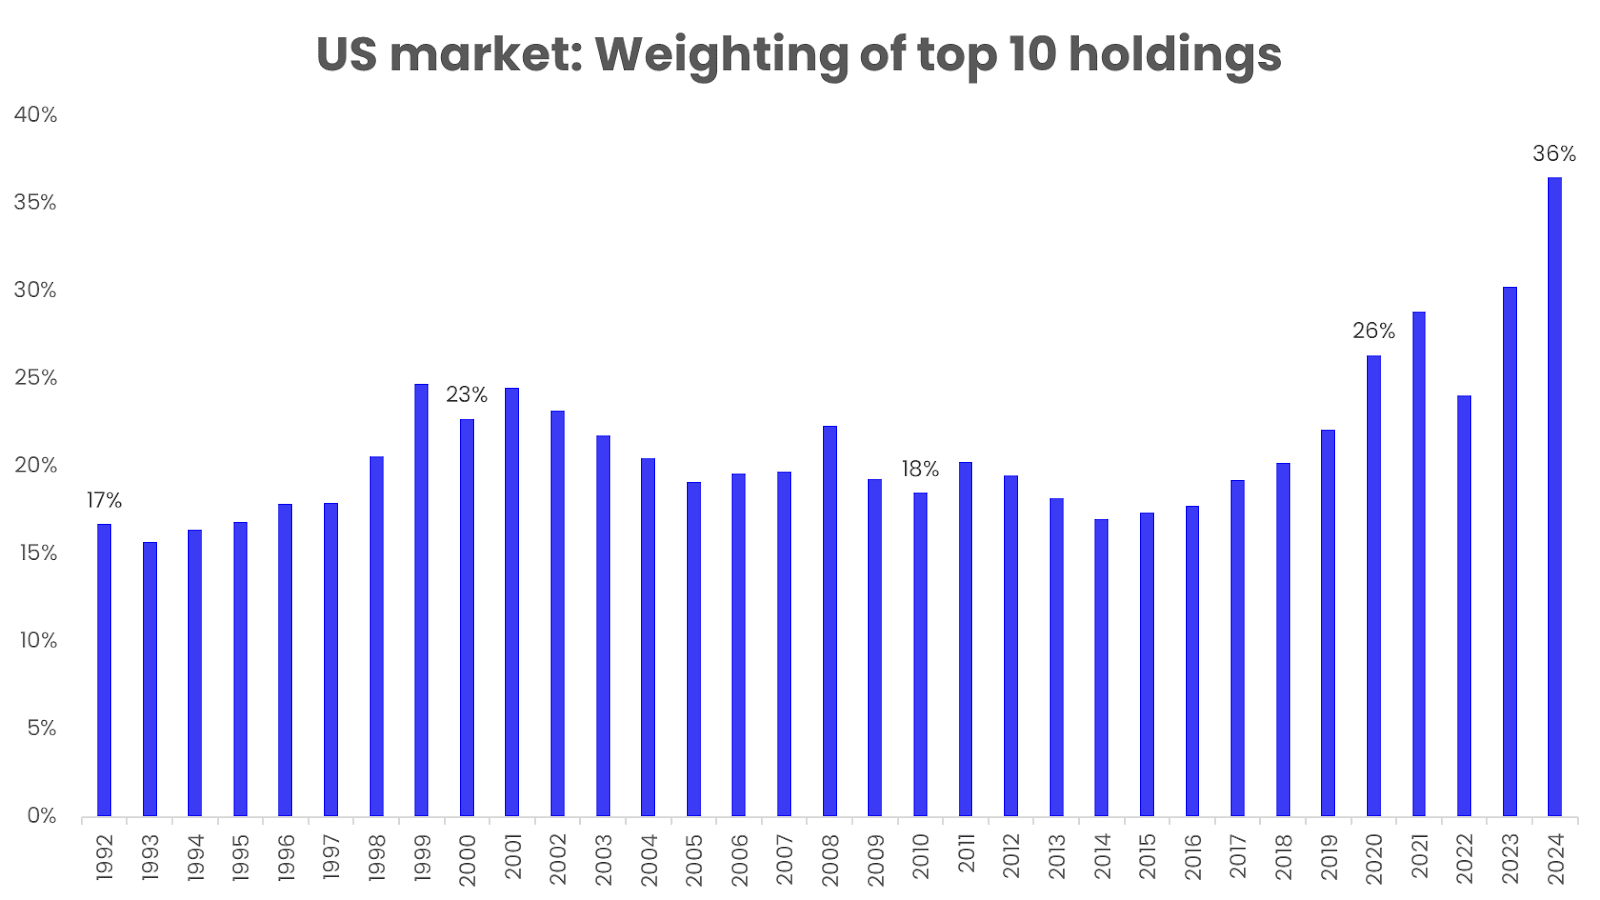
Perhaps the concern which has received more attention than any other this year (Trump aside), has been the level of concentration in the US stock market. Currently the top ten firms account for more than almost 40% of the total market cap of US equities, higher than any time in the last 30 years.
Intuitively, such concentration may seem worrisome. A market dominated by a handful of companies risks amplifying the impact of any single underperformer on overall portfolio returns. Diversification is a fundamental portfolio construction concept, yet the markets appear to be becoming less and less diversified.
Such levels of concentration, though, are not unheard of in market history. Current levels are similar to those in the 1930s, 1950s, and 1960s. In the mid-1950s, just three stocks, IBM, AT&T, and GM, accounted for around 28% of the total market cap of the stock market. And in 1960, a single stock, AT&T, represented 13% of the entire market – roughly double the weight of today’s largest stock. So, today’s level of market concentration is not unheard of for the US.
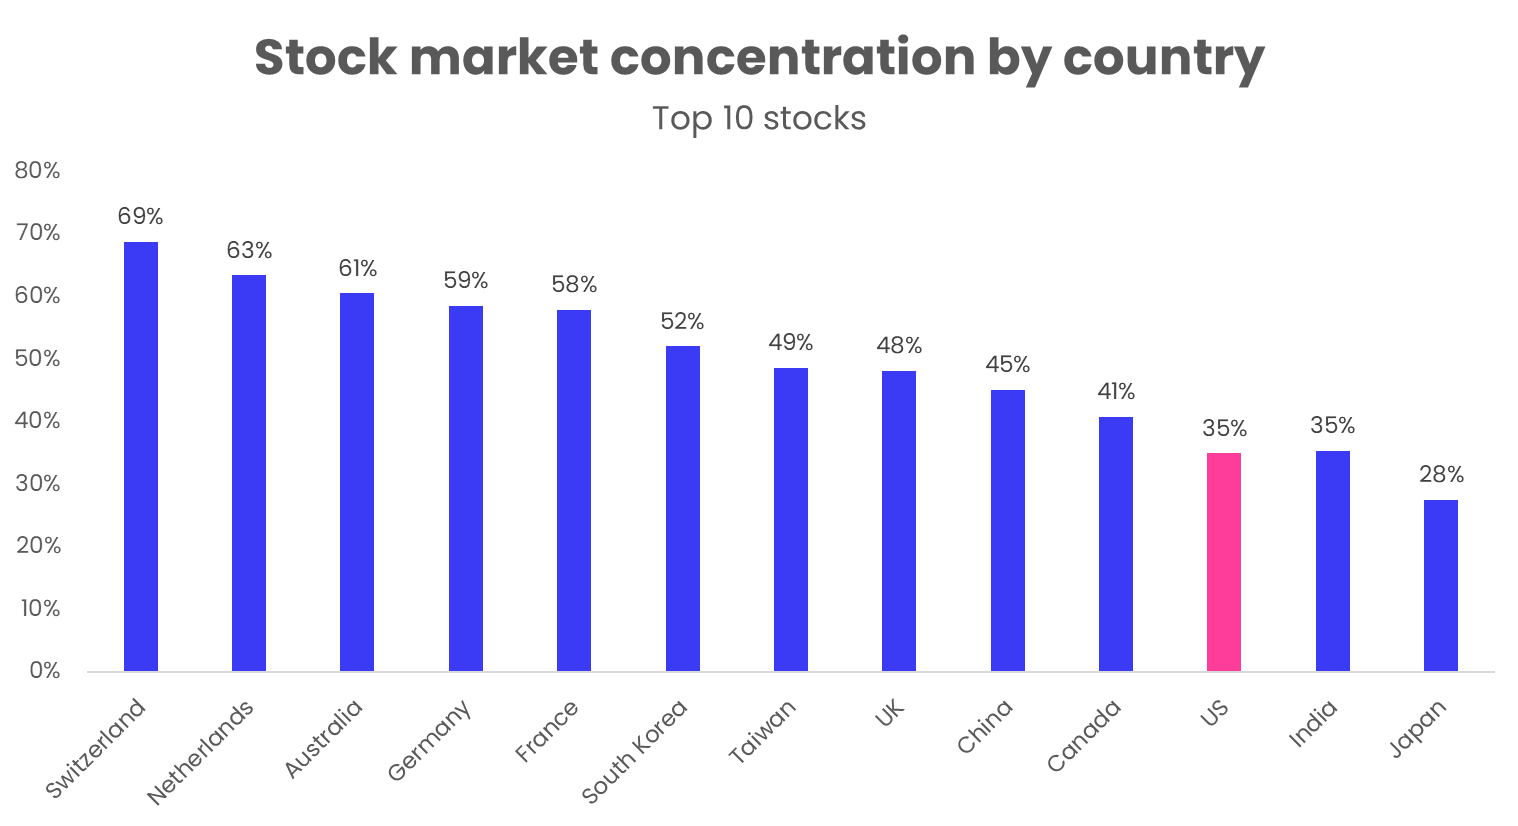
Also, as we noted in our half-year commentary, relative to other markets, the US stock market is no outlier. Some countries in Europe, notably Switzerland and France, have much more concentrated stock markets than the US. Switzerland has over 30% of its market in only 2 stocks – Nestle and Novartis. Our very own FTSE 100, while not exactly a poster-child for a booming market, has almost 50% in the top 10 companies. So, both relative to history and relative to other regions, the US stock market is not at alarming concentration levels.
Research suggests that concentrated equity markets are, in fact, the norm. Markets are inherently concentrated, as only a tiny handful of companies are responsible for the entirety of a market’s gains over the long run. Most stocks end up being woeful investments, and markets in aggregate only rise because a small number of exceptional companies produce returns high enough to offset the vast majority of underperforming stocks.
In fact, market returns are so skewed that according to one study, only 2.4% of global stocks accounted for the entirety of global stock market wealth created between 1990 and 2020. Not only that, but the majority (55%) of stocks actually underperformed 1-month US treasury bills over the period.
This is a fascinating finding, and one which demonstrates how difficult individual stock selection is. Active investors, those investors who try to outperform the market, are tasked with finding those tiny minority of stocks which will generate all the wealth. And if they fail to find them, then the active manager will, with almost mathematical certainty, underperform the broad market (which, by definition, will always hold those super-stocks). Finding the needle in the haystack is an incredibly difficult task, and almost impossible to do repeatedly on a consistent basis. Investors holding broad global-market funds, on the other hand, will always hold those tiny minority of stocks. They, as John Bogle famously said, simply buy the haystack.
Additionally, many of today’s largest companies are themselves diversified. The Magnificent 7 companies have a vast array of business lines – streaming, e-commerce, cloud storage, etc. This makes the US market more diversified than it initially appears, with essentially independent businesses all operating under a single roof.
Were an antitrust regulator to force one of these companies to break up into its constituent parts, market concentration would decline overnight. But would this make investors’ portfolios less risky? One could argue that a single large company containing multiple business lines is less risky for investors than several competing ones.
The more important determinant of future performance is not concentration, but valuation. And while concentration and valuation have been positively correlated in the past, high valuation is not an inherent feature of highly concentrated markets. Take the tech bubble of the late 1990s, during which a very concentrated market eventually underperformed. The cause of the underperformance was not concentration, but rather the expensiveness of the market. For investors, focusing on valuation metrics rather than structural concentration is likely to yield more meaningful insights into future market behaviour.
Should investors be worried about valuations?
A stock market’s valuation reflects the relationship between share prices and the underlying fundamentals of its companies, such as earnings, cash flow, and book value. For the US market, valuations are currently at their highest point since the dot-com crash, giving many investors cause for concern going into this year.
While US stocks have generated outsized earnings this year, mainly driven by the large AI stocks, the market’s expectations for these companies have increased at a faster rate. This means stock prices have risen faster than earnings, leading to a higher valuation multiple.
One of the most widely-used metrics to measure valuations is the Cyclically Adjusted Price/Earnings ratio (CAPE), first put forward by the legendary value investor Benjamin Graham in the 1930s, and made popular by the Yale University Nobel laureate Robert Shiller. The P/E ratio is a valuation metric that measures a stock’s price relative to the company’s earnings. The CAPE ratio differs from a regular P/E ratio, as it uses earnings over a 10-year period to smooth out fluctuations in profits that occur over different periods of a business cycle. The CAPE ratio is generally applied to broad equity indexes to assess whether the market is undervalued or overvalued.
Looking at the S&P’s current valuation, as measured by CAPE, it’s clear the US is trading some way above its long-term average:
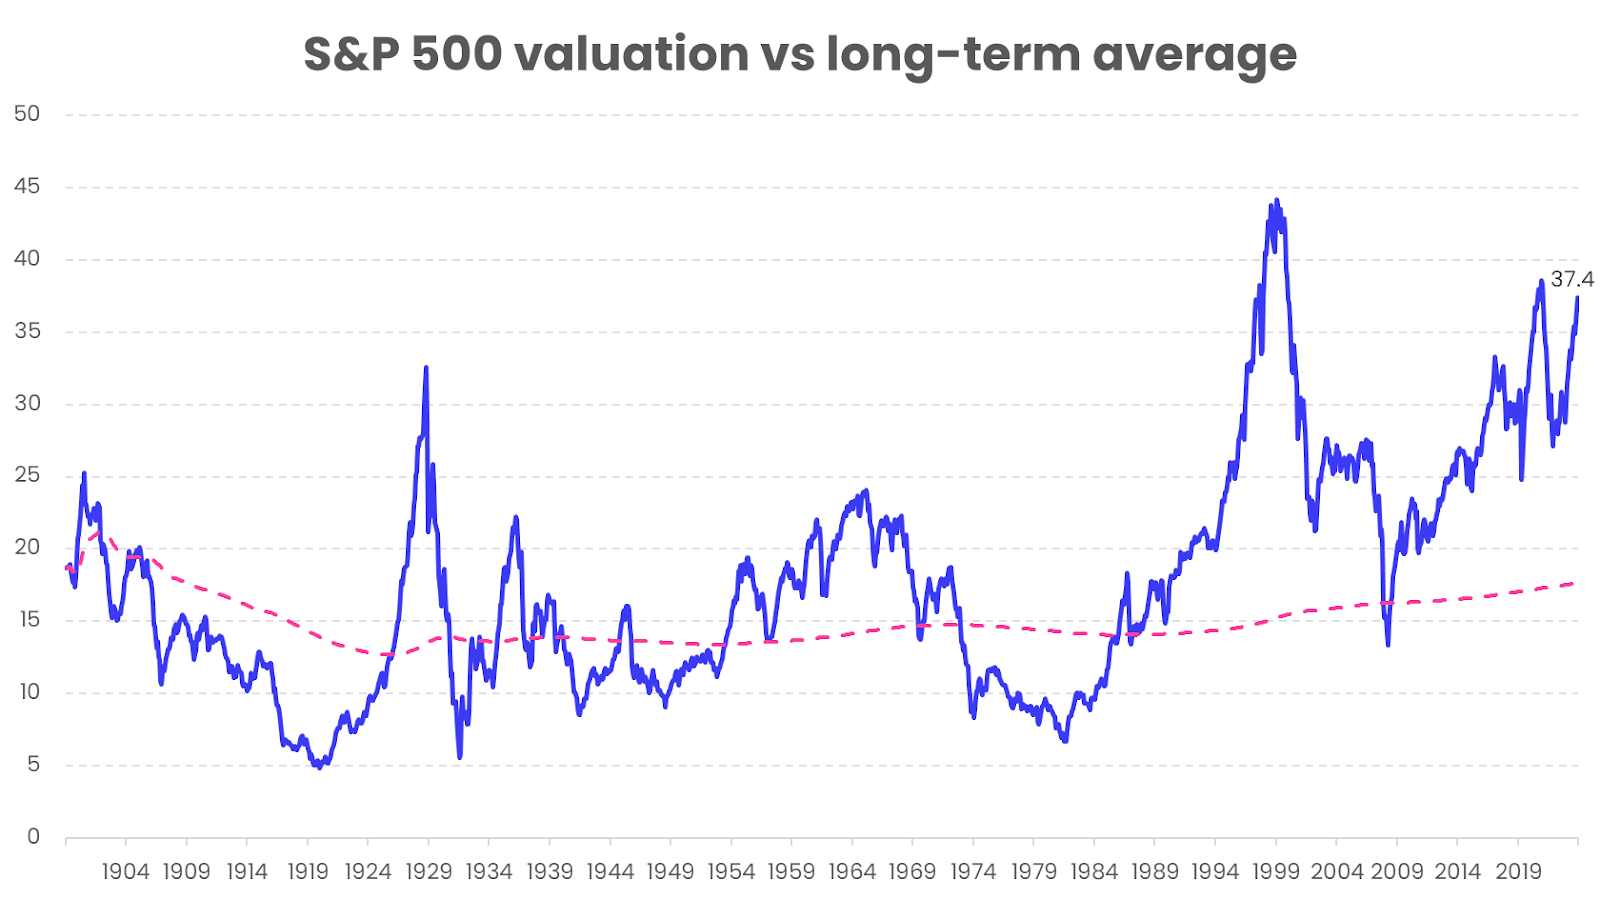
There are reasons why the CAPE would rise over time. Profitability and productivity increases, combined with more accessible financial markets, plus investors allocating more to equities all contribute to structurally higher valuations. But it’s disconcerting that the S&P is more expensive than on the eve of the Great Crash in 1929, and not much cheaper than when the dot-com bubble burst in early 2000.
Looking at 2024’s return, we can break the return down into its constituent parts. In the US, while earnings growth has contributed just over 10% to this year’s returns, the majority of returns have come from valuation change – i.e. prices rising faster than expected earnings.
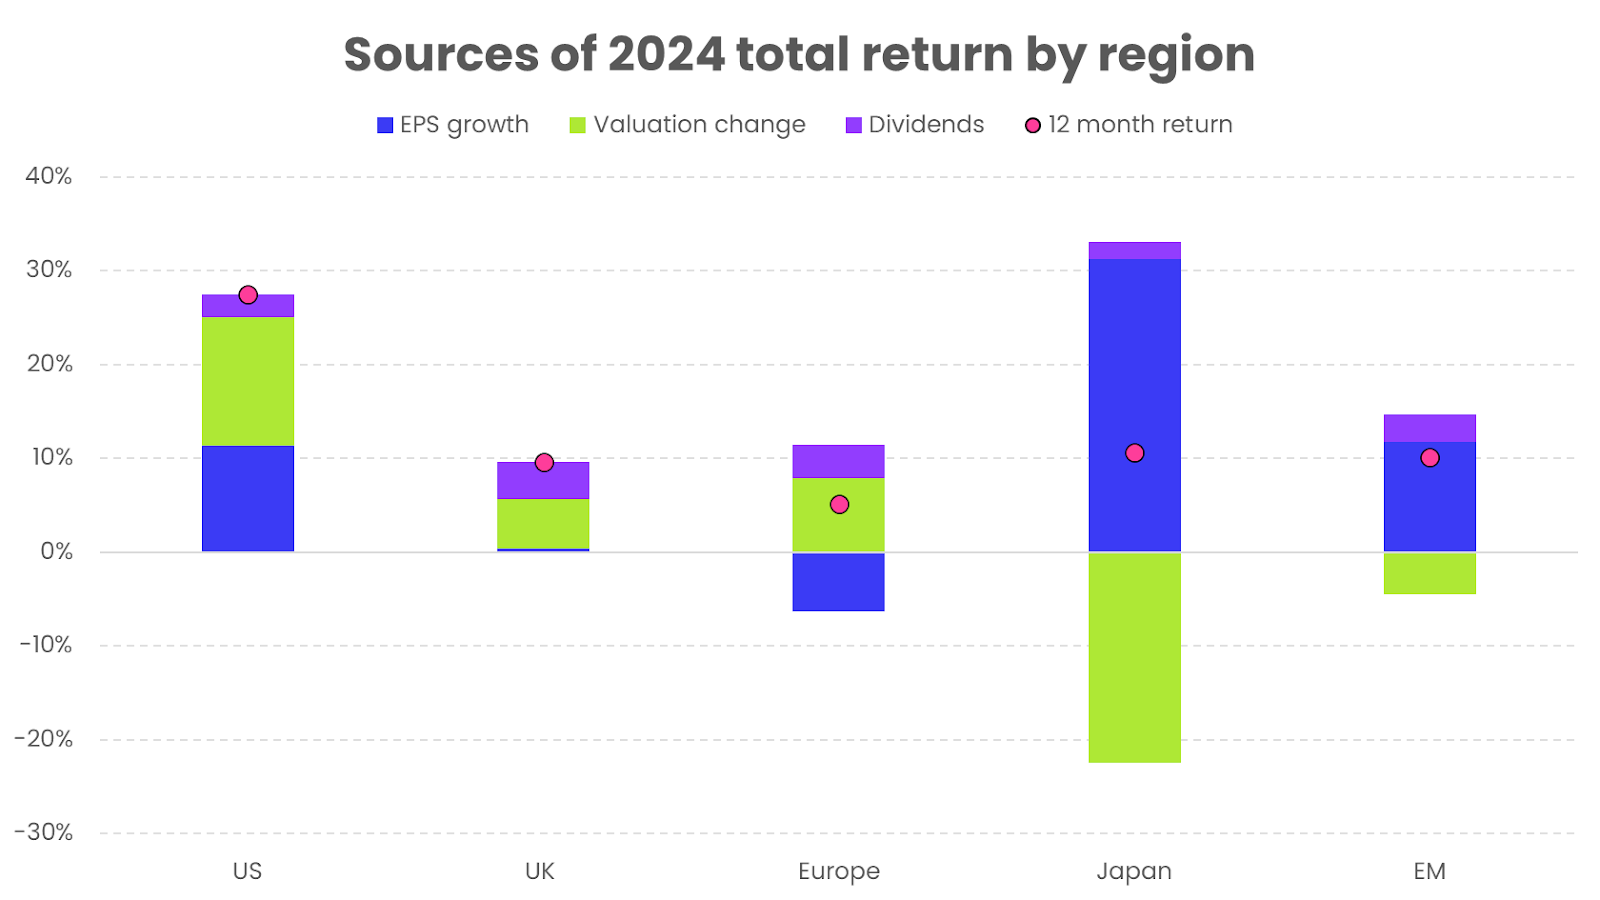
This is not so for the rest of the world, where valuations haven’t risen as much this year, and in some cases, EM and Japan, valuations have actually shrunk.
Looking at other region’s valuations over time is a useful exercise, as it helps contextualise the widening gap of the USA vs the rest of the world. The chart below shows the P/E ratios of four major markets over the last 20 years. The US has historically traded in line with the other regions, but over the last few years has become significantly more expensive than other major markets:
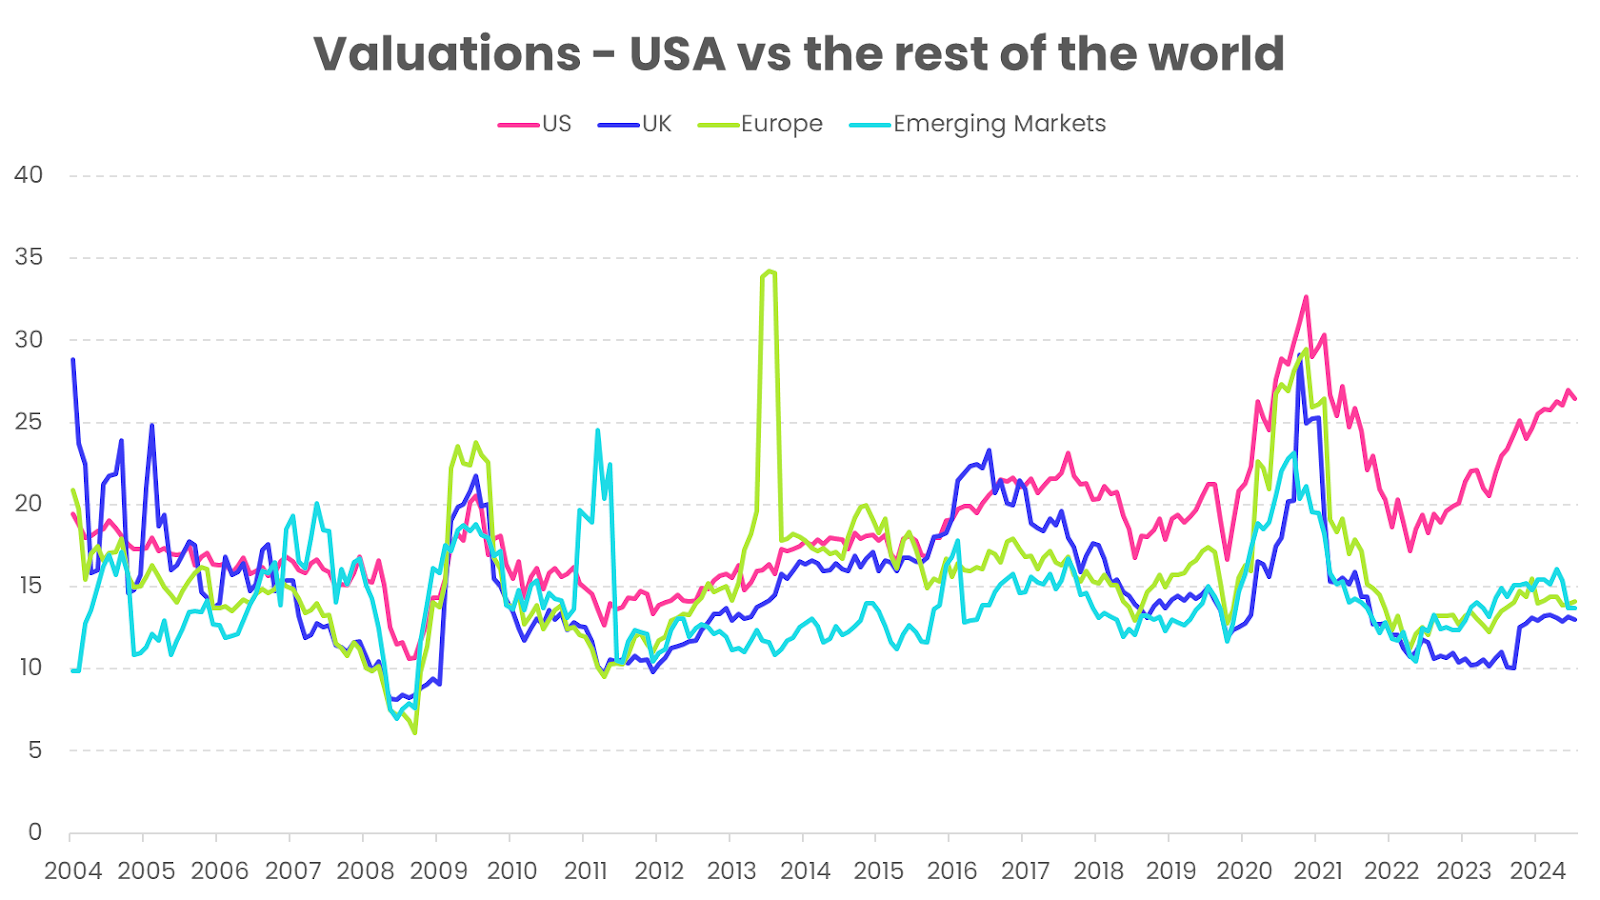
It’s tempting to attribute this divergence to the rise of artificial intelligence companies – the largest of which are all located in the US. These companies have better fundamentals and growth prospects than companies located elsewhere – so investors are happy to pay a premium for them, which boosts the USA’s relative valuation.
And while that’s no doubt a large part of the story, looking slightly deeper shows that this isn’t just an AI story. Adding a US equal weight index to the chart, which weights all members of the S&P equally (so Walmart has an equal weighting to NVIDIA), shows how valuations have changed for the broader US market:
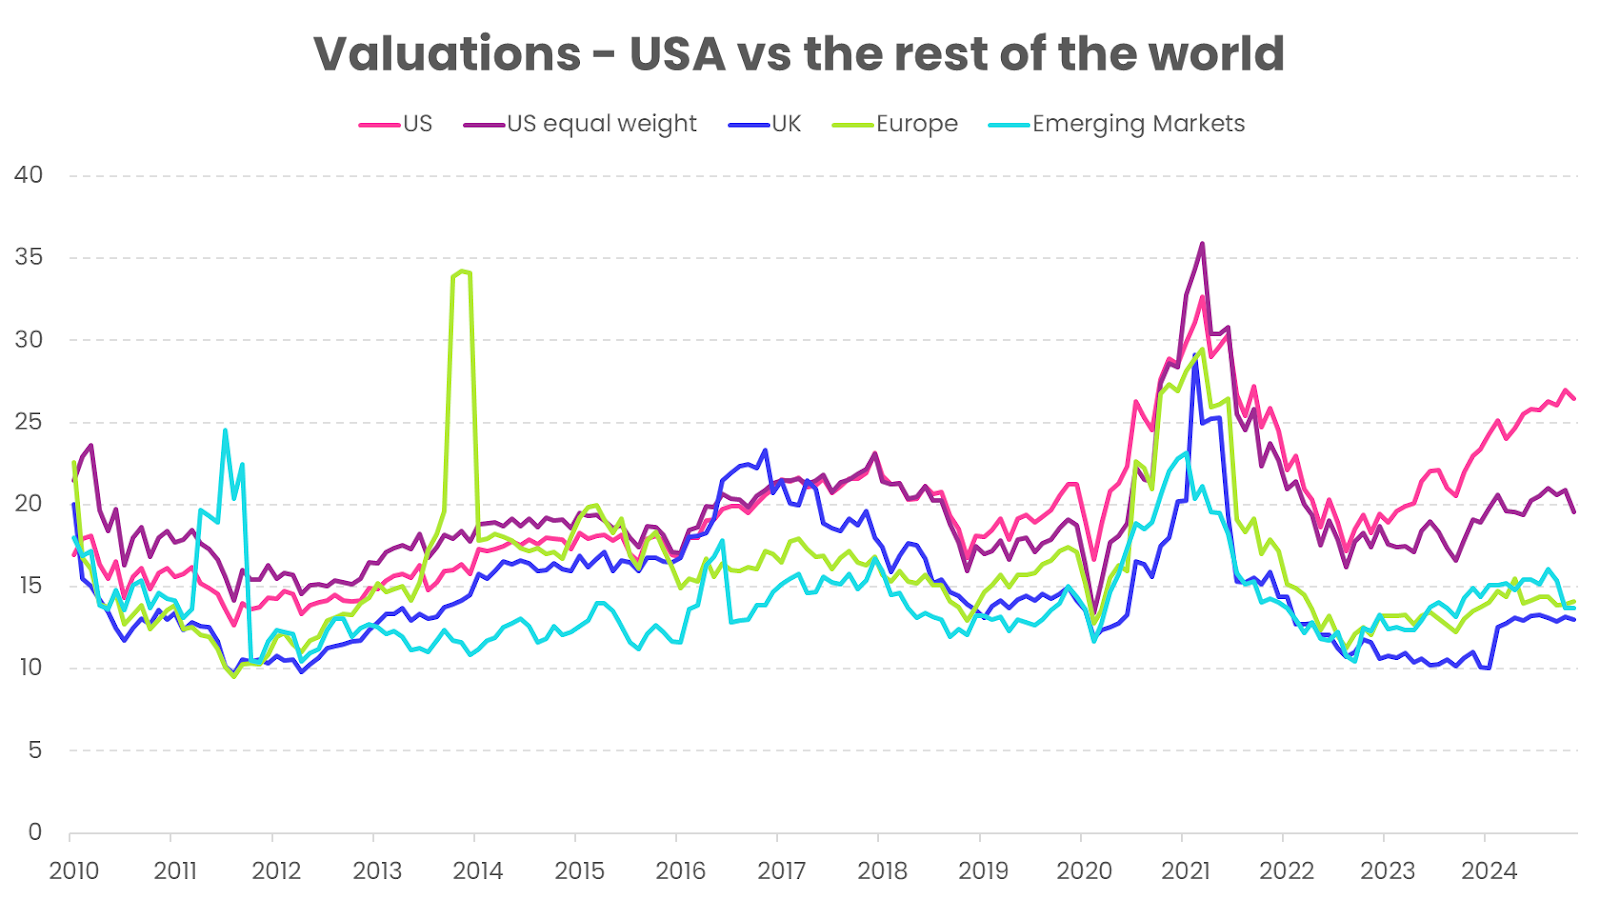
The equal weight index traded at similar valuations to the market cap weighted index until mid-2022, when the AI boom took off with the launch of ChatGPT. This disproportionately benefitted the larger AI companies, leading to the market-cap weighted valuation increase. But even though the equal-weight doesn’t have a large allocation to AI stocks, it still saw its valuations rise, and stay well above other regional markets. It’s not extreme, but shows the US isn’t just expensive because of the AI stocks – investors are placing a premium on the broad US market heading into 2025.
What does this mean for investors?
Elevated valuations mean little in the short term. Over periods less than 10 years, markets can remain expensive for considerable periods of time before showing any signs of mean reversion. But over the longer-term, valuations matter.
The more expensive a stock when you buy it, the lower the return you’re likely to see over the next decade. This relationship doesn’t hold at all in the short term (an expensive market can always get more expensive), but over the longer term higher valuations drag on returns.
The chart below shows the starting CAPE ratio for the S&P 500 compared to its subsequent 10-year returns:
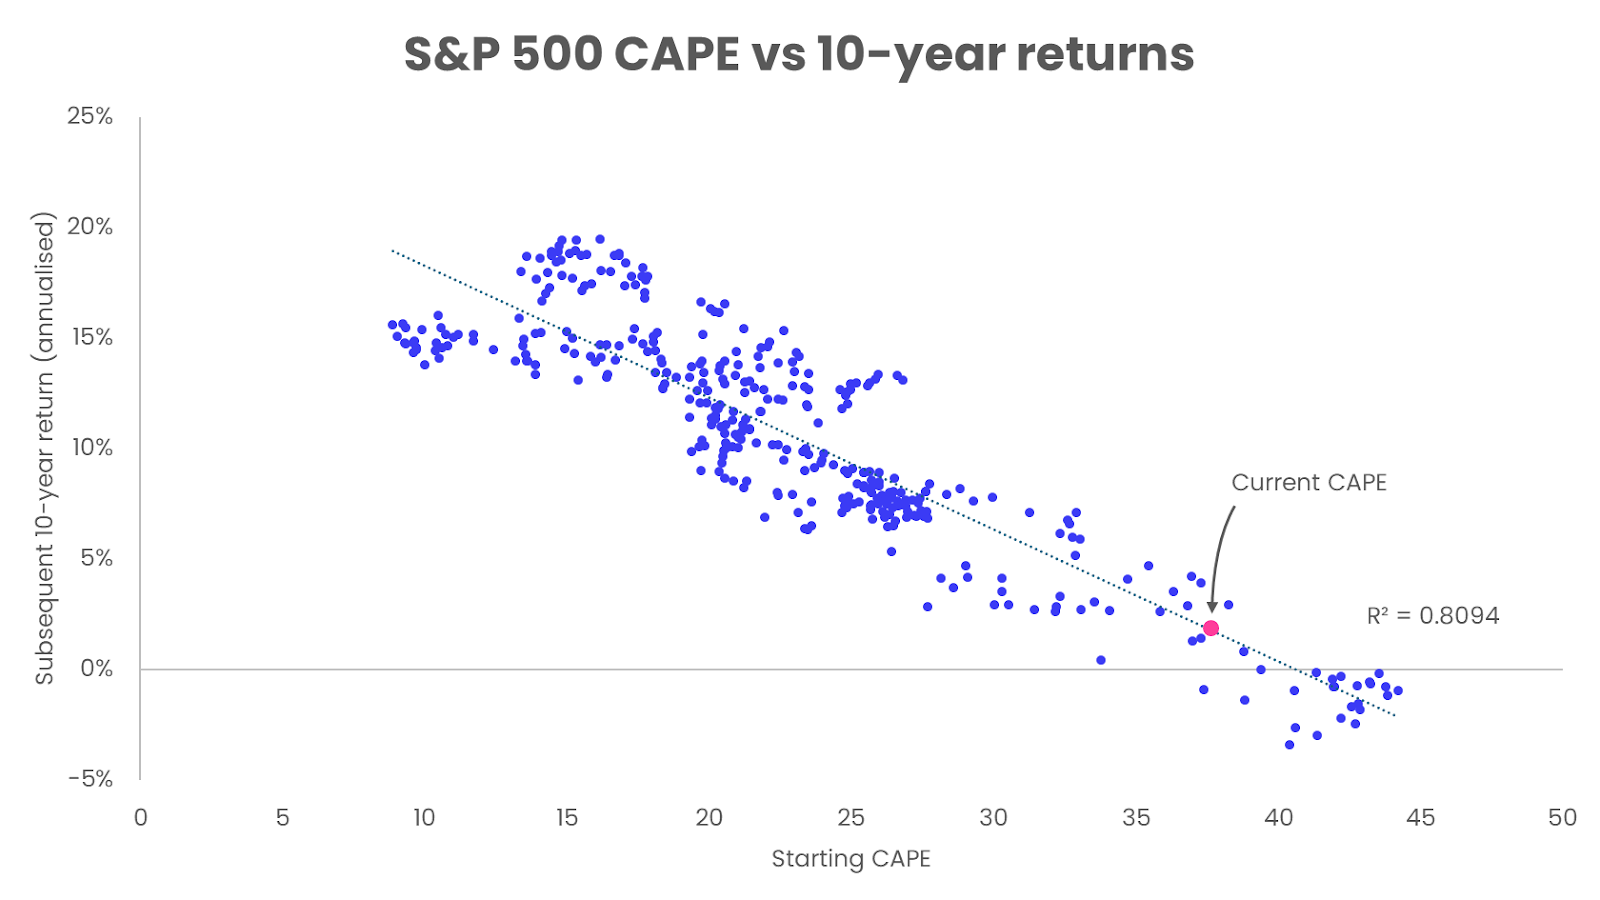
The chart shows a seemingly strong negative correlation between starting CAPE and subsequent 10 year returns. High CAPEs suggest lower future returns, and low CAPEs suggest higher returns.
The current CAPE ratio is highlighted in pink, with prices at 37.4x earnings. This implies an expected return over the next 10 years of around 1.8%, according to the CAPE model. This is significantly lower than the returns investors have become accustomed to over the last 10 years.
Now, this model is not perfect. For one, it assumes all starting CAPE values are equally relevant, and equally as useful for forecasting today’s returns. This is clearly not the case, as the market in 1984 (when the data for this chart starts) was a very different one from today. Energy companies were 30% of the market – today they are 3%. Technology companies were 5%, today they are over 30%. The internet was still a decade away from any kind of mainstream adoption, and interest rates were at over 10%. So it’s hardly a fair comparison to use the subsequent 10-year return for a CAPE level in 1984 and use it to try and forecast the next 10 years from today.
There is also an issue of lacking independent 10-year periods. Monthly observations have much overlap when measuring over rolling 10-year windows, which can give the misleading impression of many distinct data points. This can give the impression of a stronger relationship than may actually exist.
Despite its imperfections, there is at least some intuition behind the relationship between valuations and returns. The gap between the price investors are willing to pay and company earnings can only grow so wide before one trends towards the other. As a result, the CAPE ratio provides investors with a useful benchmark for setting longer-term expectations. Given the current high valuations, these expectations should be tempered – investors should remain mindful of the long-term implications of paying a premium for stocks, with lower returns likely in the decade ahead.
Is it different this time?
The idea that the market is fundamentally different than in the past, and therefore historical data is of less relevance when making forecasts is perhaps best exemplified by the common rebuttal “this time is different”.
Today, the transformative potential of artificial intelligence has led many investors to question whether the traditional rules still apply. If we’re in a new paradigm, then maybe this time really is different. The size of these behemoth companies, their profitability, and the technology they’re creating, may allow them to protect their long-run margins from competition, protect themselves from regulatory interference, protect their market share, protect their size advantage, negate diseconomies of scale, and protect the oligopoly which they’ve created. Maybe these companies deserve to be valued so highly because they’re simply better.
Looking at a snapshot of the 10 largest companies today versus the 10 largest in 1999 helps illustrate both why we’re unlikely to be in a bubble (contrary to what many of the market doomsayers believe), and why today’s companies command such a premium.
Largest stocks in 2024
| P/E ratio | Net margin | RoE | |
| NVIDIA | 54 | 49% | 127% |
| Apple | 37 | 24% | 157% |
| Microsoft | 35 | 36% | 36% |
| Amazon | 46 | 5% | 23% |
| Alphabet | 25 | 24% | 32% |
| Meta Platforms | 27 | 29% | 36% |
| Tesla | 198 | 15% | 21% |
| Berkshire Hathaway | 23 | 22% | 19% |
| Broadcom | 89 | 11% | 13% |
| JP Morgan Chase | 13 | 31% | 17% |
| Average | 55 | 25% | 48% |
| Median | 36 | 24% | 27% |
Largest stocks in 2000
| P/E ratio | Net margin | RoE | |
| Microsoft | 73 | 40% | 31% |
| General Electric | 29 | 10% | 26% |
| Cisco | 221 | 19% | 19% |
| Walmart | 58 | 4% | 23% |
| Intel | 35 | 25% | 26% |
| Nokia | 71 | 13% | 41% |
| Pfizer | 80 | 21% | 46% |
| Deutsche Telecom | 40 | 8% | 4% |
| BP | 48 | 6% | 12% |
| Exxon Mobil | 28 | 5% | 16% |
| Average | 68 | 15% | 24% |
| Median | 53 | 11% | 25% |
The first comparison worth making is that valuations today are still some way below where they were before the dot-com crash. Today’s largest stocks have a median P/E of 36x earnings, compared to 53x in 2000 (averages are skewed by Tesla’s mammoth premium today, and Cisco’s in 2000). Markets today are much cheaper than they were before the bubble burst in 2000.
Secondly, and of more relevance for justifying today’s expensive market, companies today really are better than they used to be. Average and median net margins are roughly double what they were 20 years ago, and returns on equity for today’s 2 largest companies are 3-5x versus the largest companies of yesteryear.
So it is possible it’s different this time. It’s possible these companies don’t behave like those in the past, because they’re larger, less vulnerable to antitrust regulation, more profitable, more acquisitive, and more efficient.
However, history warns against overconfidence in such assumptions. The belief that the current market is immune to the forces that have shaped past cycles is a dangerous one. While it is possible that today’s companies represent a new paradigm, investors should remain cautious about dismissing the lessons of history, which consistently remind us that markets – and their leaders – are rarely immune to change. What’s more, the high expectations already baked into today’s valuations set a daunting bar for future returns.
What would it take for the US to continue to outperform?
When considering the outlook for the markets from here, it’s important to consider that the higher earnings and higher valuations which have driven returns over the last decade are also what sets a high bar for outperformance looking ahead.
The large AI companies have continued to beat estimates this year, and while that’s been great for investor returns, it’s also meant the market has quickly reassessed its expectations for these companies, and the market continues to expect more.
Research from Goldman Sachs shows that the market is pricing in earnings growth of around 20% per year from these companies. But history shows that the number of companies which can consistently deliver 20% or greater growth and high margins is extremely small and fades dramatically over time, with almost no companies able to successfully do so over a decade.
Putting some numbers around this, over the past four decades, the share of S&P 500 companies that were able to generate 20%+ revenue growth for 10 consecutive years was only around 3%. It therefore seems likely that the earnings performance of these companies will disappoint current euphoric market expectations over the longer run.
This aligns with the lessons of history. As discussed in our half-yearly review, the dominance of today’s top companies is unlikely to endure indefinitely. Looking back at the top 10 companies by decade, it’s clear the market doesn’t let stocks get too comfortable at the top:
| 1980 | 1990 | 2000 | 2010 | 2020 | 2024 |
| IBM | NTT | Microsoft | PetroChina | Saudi Aramco | Apple |
| AT&T | Bank of Tokyo-Mitsubishi | General Electric | ExxonMobil | Apple | NVIDIA |
| Exxon | Industrial Bank of Japan | NTT Docomo | Microsoft | Microsoft | Microsoft |
| Standard Oil | Sumitomo Mitsui Banking | Cisco | ICBC | Alphabet | Amazon |
| Schlumberger | Toyota | Walmart | Walmart | Amazon | Meta |
| Shell | Fuji Bank | Intel | CCB | Meta | Tesla |
| Mobil | Dai ilchi Kangyo Bank | Nippon Telegraph | BHP Group | Berkshire Hathaway | Alphabet |
| Atlantic Richfield | IBM | Nokia | HSBC | Tencent | Broadcom |
| General Electric | UFJ Bank | Pfizer | Alphabet | JP Morgan | Berkshire Hathaway |
| Eastman Kodak | Exxon | Deutsche Telecom | Apple | Visa | JP Morgan Chase |
The largest companies in 1980, dominated by the oil majors, largely disappeared from the top 10 by 1990. Then, in 1990, when Japan was set to take over the world, those largest companies followed the same fate, and were replaced by an entirely new set in 2000. The tech crash came for those companies, and by the next decade had been replaced by rising Chinese companies. In turn they fell too, and 2020 saw the start of tech dominance, while now it’s the turn of the AI companies to rise to the top.
Adding to the challenge, research from Bridgewater suggests the US would need to sustain 7% earnings growth to maintain the historical average of an equity return of 4% return above bonds. Compare this to the rest of the developed world, which needs only 3% earnings growth, and China which can actually see negative growth of -1% and still earn a 4% risk premium over bonds. The expectations today for the US are significantly higher than a decade ago and relative to other equity markets.
For investors, these dynamics suggest caution. While the current market optimism reflects confidence in innovation and profitability, the high bar for performance leaves little room for error, particularly over the long term.
To briefly wrap up this section on what valuations can tell us about the next decade, current valuations suggest that the US market is expensive both by historical standards and relative to other regions. This trend extends beyond the AI giants, as smaller US stocks also trade at higher valuations than their global peers. High starting valuations have historically been linked to lower 10-year returns, which presents a challenge for investors looking ahead.
While the argument that “this time is different” carries some weight given the unique strengths of today’s market leaders, history warns against assuming any company – or market – can maintain dominance indefinitely. The extraordinary returns of recent years are unlikely to be repeated, although the U.S. market has exceeded expectations before. Still, the odds favour more modest returns in the years ahead.
That said, this is not a call to divest from US equities entirely. Making large asset allocation decisions based on historical precedent can be dangerous when the statistics being used are far from conclusive, and when today’s companies differ meaningfully from those in the past. Instead, the current environment suggests two key takeaways: one, that returns for US equities are likely to be lower than what we’ve experienced in the past, and two, that returns for US equities are likely to be lower relative to other countries. Investors should be moderating expectations accordingly.
Trumponomics
No commentary on 2025 would be complete without mentioning the impact of a Trump presidency. We have, however, left this topic for last for good reason. Our investment process is quantitatively driven, based on systematically generated capital market assumptions and expected returns, using mean-variance optimisation to guide our asset allocation decisions. We do not engage in speculative forecasting.
Predicting market events by peering into next year’s crystal ball is a recipe for bad decision-making, and something we try to avoid. To be a profitable forecaster, one must correctly predict what will happen, when it will happen, how it will affect markets, and for that prediction to not already be priced in. This combination is impossible to achieve consistently, especially when considering all the human behavioural biases which plague the decision-making process along the way. This is one of the many reasons over 90% of traditional actively managed funds underperform.
That said, all investors must rely on assumptions. Even if the assumption is something as simple as “over the long-run, stocks beat bonds” (although even this assumption has been brought into question recently). We prefer our core assumptions to be based on decades of academic and empirical evidence, relying only on those which have stood the test of time and scrutiny. We believe this results in more robust portfolios, which are less vulnerable to subjective biases or short-term narratives.
With the caveat that we aren’t making qualitative judgements on Trump’s market impact, or altering positioning in portfolios as a result, it would be remiss not to pass brief comment on the potential impact of his policies.
With a majority in both the Senate and House of Representatives, albeit a slim one, the Republicans will have more power to enact their policies this time around. Trump’s planned tariffs, tax cuts, deregulation, and strict immigration policies are all, in theory, inflationary. The Federal Reserve, already navigating a delicate path for interest rates, may face renewed pressure to slow or reverse rate cuts, or even resume hikes.
Higher rates are not likely to be well received, as the market is currently confidently forecasting rates going nowhere but down. This about-turn would come as an unwelcome surprise to markets, and would bring considerable uncertainty as they guess how high the Fed would choose to go.
Higher rates, generally seen as a headwind for stocks, may weigh on sectors like technology, which are particularly sensitive to changes in the discount rate. However, recent market behaviour has complicated this narrative, as technology stocks performed well even during the last rate hike cycle. Either way, the market would likely not react well to rates staying higher for longer as a result of inflationary policies.
Higher rates are also likely to support the dollar, as high short-term rates encourage more global capital to be held in dollars. This is at odds with Trump’s explicit aim to weaken the dollar, but would be a welcome tailwind for us sterling investors.
It’s worth remembering, as Trump starts making headlines again next year, that as much as market participants enjoy prognosticating about the impact of governmental policies, the market doesn’t care who’s in the White House.
It’s crucial, however, to maintain perspective. Historical data consistently shows that markets are less influenced by who occupies the White House than by the earnings power of the companies within them. The S&P 500 has delivered consistent returns in the range of 10–15% regardless of who the president is or which party they belong to:
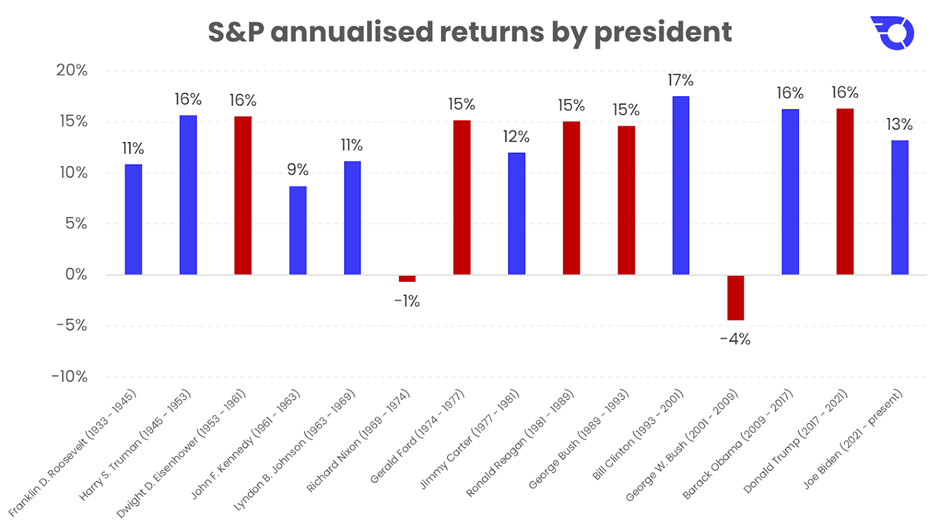
As much as power as individual presidents have, their ability to radically alter the earnings potential for the many hundreds of highly diversified, global companies which make up the US stock market is more limited than many investors realise.
This underscores a fundamental truth: while presidential policies may create short-term volatility, the long-term drivers of market performance remain firmly rooted in corporate earnings. As 2025 unfolds and Trump headlines dominate, investors would do well to bear this in mind.
How should investors position themselves going into 2025?
As we enter 2025, the financial markets face a complex landscape shaped by high valuations, market concentration, and evolving geopolitical factors, including the potential impact of a Trump presidency.
The US stock market, while buoyed by robust performance from large-cap technology and AI companies, has now become concentrated. The top ten firms now account for nearly 40% of the total market capitalization, the highest in decades. But while this level of concentration might appear worrisome, historical parallels and global comparisons reveal that it is not unprecedented, nor unique to the US. Investors should be less concerned with concentration, and more concerned with valuations.
Elevated valuations have historically been associated with lower long-term returns, and the US market’s current premium relative to other regions underscores the challenges ahead. While the rise of AI has significantly contributed to this disparity, the broader US market, including smaller-cap stocks, also trades at a premium compared to international markets. This indicates that the issue extends beyond technology and reflects higher expectations for US equities as a whole.
The dominance of AI companies and their unprecedented size and profitability has prompted questions about whether “this time is different”. While these firms appear better equipped to sustain their margins and market share than past leaders, history warns that no company remains at the top indefinitely. High expectations for these firms, with market forecasts of 20% annual earnings growth, are difficult to sustain. Over the past four decades, only about 3% of S&P 500 companies have achieved such growth for a decade, increasing the likelihood of disappointment.
This suggests that returns for US equities are likely to be lower than what we’ve experienced in the past over the next decade, and that returns for US equities are likely to be lower relative to other countries. Investors should be moderating expectations accordingly.
Geopolitical and policy developments, including the potential return of Donald Trump to the presidency, add further uncertainty. Despite this, historical data consistently shows that long-term market returns are more influenced by corporate earnings than political leadership, with the S&P 500 delivering consistent returns regardless of the party in power.
While the current environment doesn’t look favourable for US equities, investors should not be abandoning the US altogether. Making large asset allocation decisions based on historical precedent can be dangerous when the statistics being used aren’t conclusive, and when today’s companies do look so different to those in the past.
But mean reversion is a powerful force in markets, and the cost of holding a diversified portfolio remains low. Valuations are cheap elsewhere in the world, and there are plenty of high-quality companies located outside the US technology sector.
A well-diversified portfolio, by definition, will always include the minority of exceptional stocks and will always have large weights to the best performing regions. But it’s also constructed to protect investors should yesterday’s winners not become tomorrow’s winners, and mitigates potential losses should investors’ bets on the current market be proved wrong.
This is why our portfolios remain diversified across all regions, sectors, companies, asset classes, and currencies. We can’t know the future, but we can construct portfolios which remain robust throughout market cycles, and which are not dependent on the performance of any single region or handful of companies.
If you would like to learn more about how we construct our portfolios, you can learn more by reading our Investment Philosophy document.
Important information
Capital at risk. The value of your portfolio with InvestEngine can go down as well as up and you may get back less than you invest. ETF costs also apply.
This communication is provided for general information only and should not be construed as advice. If in doubt you may wish to consult a professional adviser for guidance.
Tax treatment depends on personal circumstances and is subject to change, and past performance is not a reliable indicator of future returns.