When we invest, we do it to generate returns. There are occasionally additional things to consider but, ultimately, returns are the goal for any investor.
There is often a misconception about how returns actually work, however. For some, the expectation is that over time, investments will grow consistently in a neat upward curve.
This expectation is often reinforced by calculators, which are made to visualise growth more broadly. They show where the portfolio might end up over time. The problem with this is that the journey is often missing.
In this article, we’ll explain why how we think about investment returns is often wrong. We’ll also explore how they actually work.
What are investment returns?
Let’s start by just clarifying exactly what we mean by investment returns – if you know this already, skip on ahead to the next section.
Put simply, investment returns are the money your investments make. So, if you invest £100 and your portfolio is worth £110 after a week, you’ve made a £10 return (or 10%).
This growth is what investors are looking for. Different assets will have different expected returns – though returns are almost never guaranteed – but the overall growth in value of a portfolio is what we’re talking about here.
Real returns vs projections
Investment projections can be a very useful tool when deciding how much and how often to invest. There are plenty of calculators – we have a few! – you can use to see the potential growth of your cash over time.
What you’ll normally see is something that looks a lot like the chart below. It shows the growth of a portfolio over a 20 year period at a return rate of 7%. It also shows the projections for a few different fee and tax scenarios.
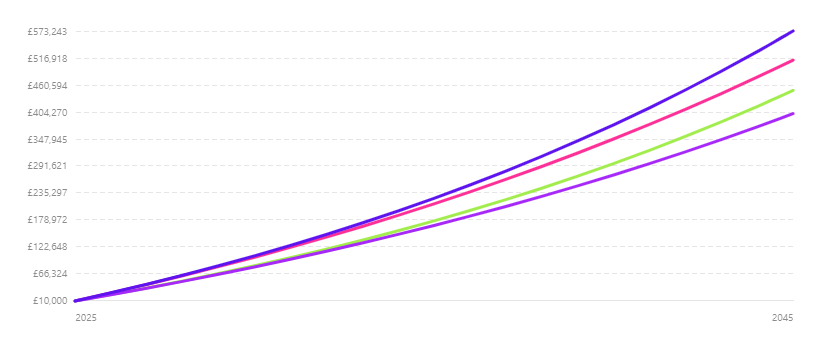
Charts like this are neat, they give the user an idea of their potential growth, the effect of fees and taxes, and how much they might have at the end of it all.
But these are exactly that: projections. They show a broad idea of investment growth, without getting into the weeds of how portfolio growth actually works over time.
The reality
In reality, returns over time involve a lot more ups and downs. Any given period, whether it’s a month or a year, your portfolio could drop in value. The hope is that, over a long enough timeframe, it grows enough to offset any dips.
So, the actual picture of investment returns is much more complex than a straight chart of growth. Here’s what 1970 to 2024 actually looked like in the MSCI World Total Return index.
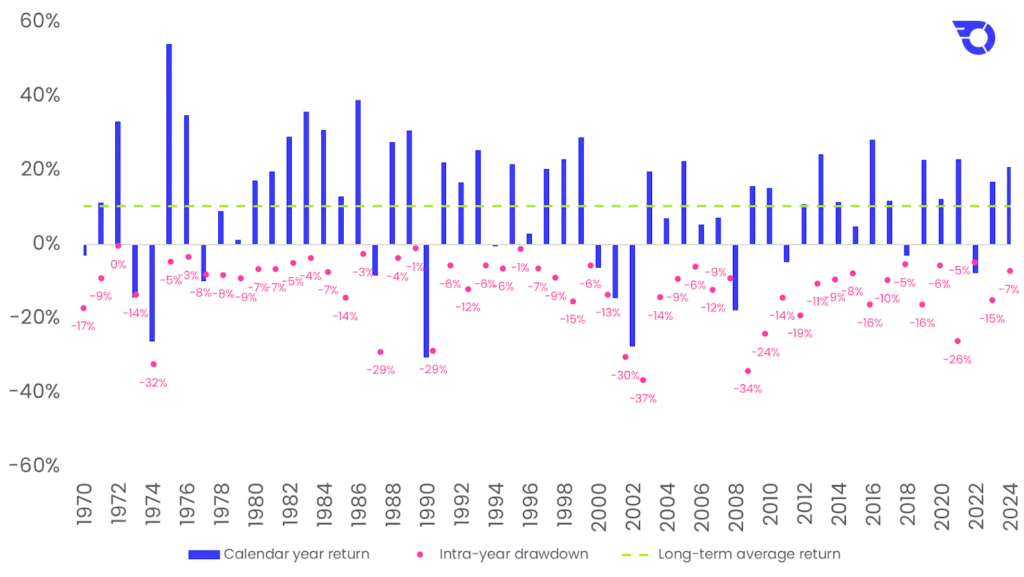
MSCI World Total Return, Currency: GBP, Source: Bloomberg.
“As you can see from the chart above, the average intra-year drawdown (the pink dots) for the global market has been -12%. That means within any given year, you can expect the market to fall an average of 12%”, says Andrew Prosser, Head of Investments at InvestEngine.
“But despite that, the stock market still goes up most of the time – there are far more blue bars above the 0% line than below it (41/55 years, or 75%). This means that even though markets always fall during the year, 75% of the time they finish the year with a positive return.
“Because markets tend to go up most of the time, even with the market dropping during the year, the long-term average return is still over 10% per year (green line).”
What this tells is that investment growth isn’t a smooth line. It’s a series of ups and downs that, we hope, leads to growth over the long-term.
That said, simplified projections can be incredibly useful tools for long-term planning. They may not tell the whole story, but often a snapshot is all an investor needs to see the impact of increasing or reducing monthly contributions, for example.
How this affects investment strategy
Having the full context of how investment returns work can have significant implications for your strategy.
Time horizon
Ultimately, it comes down to the length of time you plan to invest for. When growth is presented as a smooth chart, it might be tempting to assume you can invest for a few years and expect to see a decent return.
In reality, because growth isn’t a straight line, a longer time-frame is often a benefit. The longer you have to invest, the more time you have to ride out any ups and downs in the market and trust in the overall growth that has, historically, been seen.
Of course, past performance is no indicator of future returns, but the ability to effectively iron out market volatility with time is one of an investor’s biggest assets.
Diversification
Another aspect investors consider is how diverse their portfolio is. The chart we’ve used as an example shows the performance of the S&P 500 over time, and each individual index is likely to show a similar pattern.
Investors can attempt to smooth out their growth by investing across a number of diverse indexes, industries, asset types, etc. These won’t always go up and down at once – often, some will grow while others might fall.
So, holding a few different indexes, for example, means you can hope to make up any losses in one with gains elsewhere.
You won’t be able to completely avoid ups and downs over time. You can, however, hope to make them less significant with a more diverse range of investments.
A cool head
Perhaps an underrated attribute of any successful investor is the ability to remain calm when the inevitable downs do occur.
No investment journey is going to be without periods of negative growth – arguably the worst thing an investor can do in these situations is panic sell, cementing their losses to avoid losing any more.
What we tend to see is that after big dips, the market recovers fairly quickly. Of course, this is never guaranteed but it can often be useful to stay the course and trust in your long-term investment strategy.
The importance of a long-term perspective is also why experts won’t generally recommend checking your portfolio too often (though not many of us can say we actually follow this rule…).
The bottom line
So, investment returns are almost never a straight line. They involve ups, downs, smooth periods and periods of extreme turbulence. For investors, the takeaway is to be as serene as possible in the face of short-term fluctuations.
This is, ultimately, why projections are so useful. They smooth out the day-to-day worries that long-term investors actually want to avoid thinking about. They show the projection over 20 years, for example, without worrying about Q2 2022 or any other specific period.
Investment returns don’t work in the way some may think they do, but both ways of viewing your projected portfolio have their merits.
Important information
Capital at risk. The value of your investments may go down as well as up, and you may get back less than you invest.
Tax treatment depends on your personal circumstances and may change in future. This article is for general information only and does not constitute financial advice.
Past performance is not indicative of future performance. ETF costs also apply. If in doubt you may wish to consult a professional adviser for guidance.